Decoding COVID-19 Impact
A pure-SQL exploration of global COVID-19 data — using window functions, CTEs, and aggregation to surface global infection trends, country-level severity, and population-vaccination relationships.
SQL Server
Window Functions
CTEs
Data Aggregation
Overview
This project treats the pandemic's data trail as a SQL playground — no dashboards, no BI tool, just well-structured queries that answer real questions: which countries bore the heaviest relative impact, how vaccinations tracked against population, and where the per-capita infection rates hit hardest.
Techniques
Window Functions
Common Table Expressions
Table Joins
Aggregation & Filtering
Key Findings
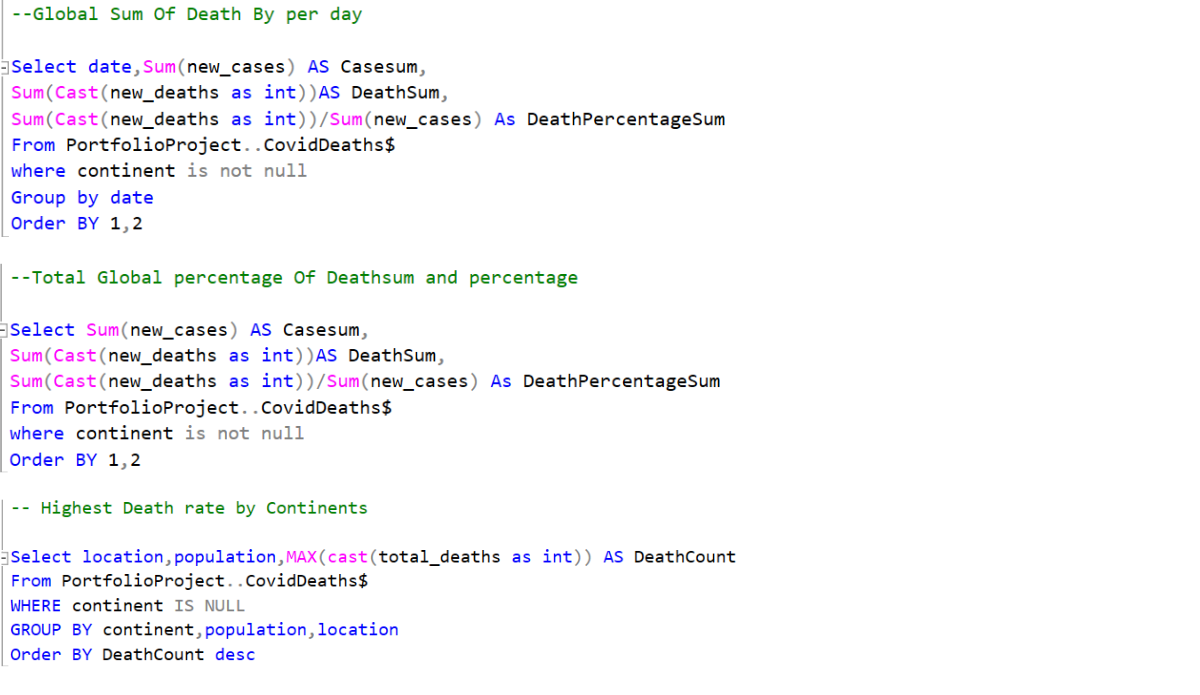
- Created window functions to uncover global trends in infection and death rates.
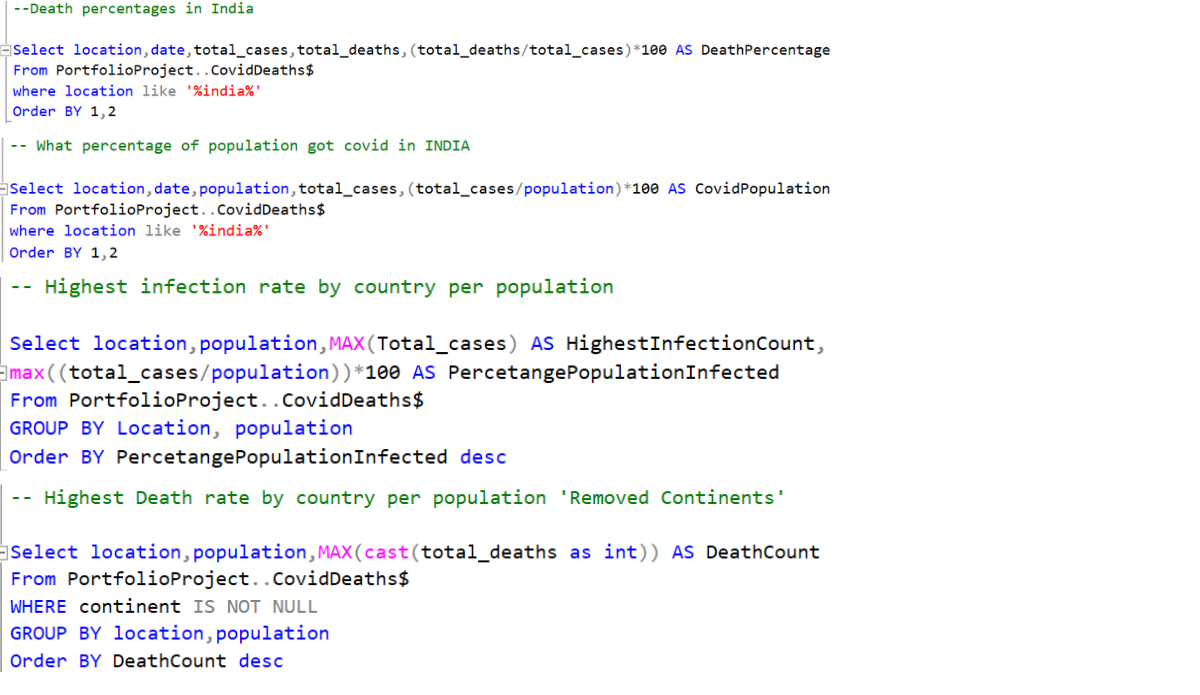
- Calculated location-specific death percentages for severity assessment through aggregation and filtering.
- Identified countries with the highest infection rates relative to population via comparative analysis.
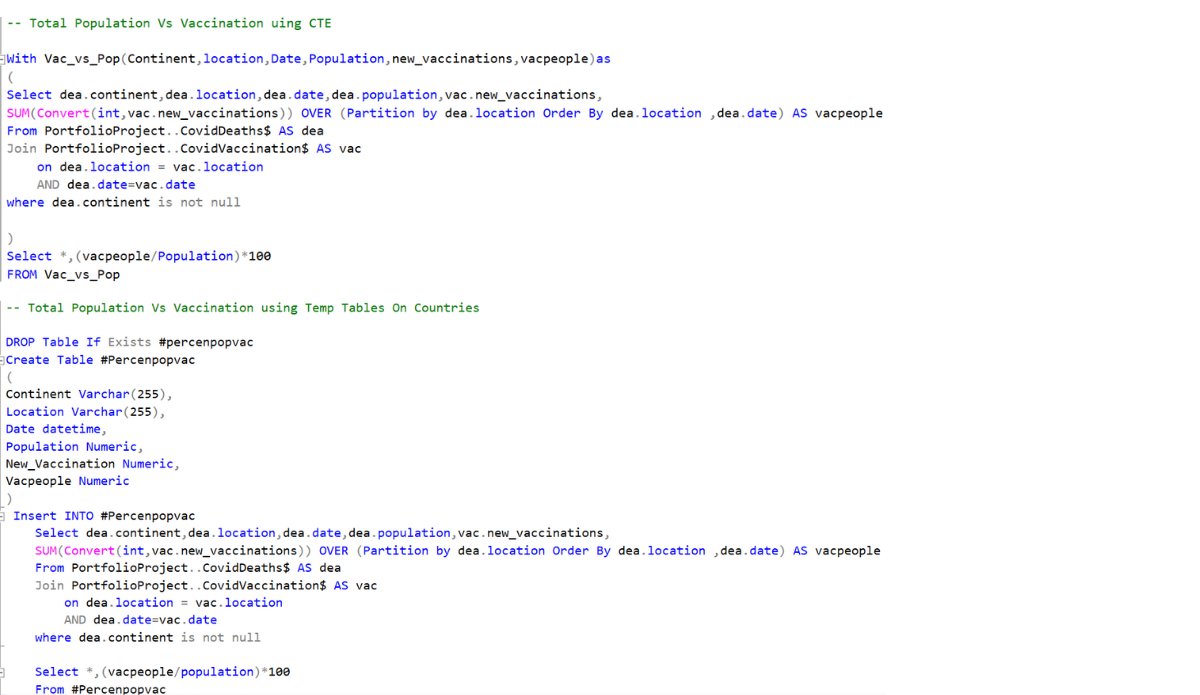
- Analyzed population-vaccination rate relationships using Common Table Expressions (CTEs).