Customer Churn Analysis
A churn-focused Power BI dashboard commissioned by PwC — identifies the percentage of retained vs churned customers, the revenue impact, and which demographics drive the risk. Built to surface actionable retention strategies.
Power BI
Python
SQL Server
PwC
Overview
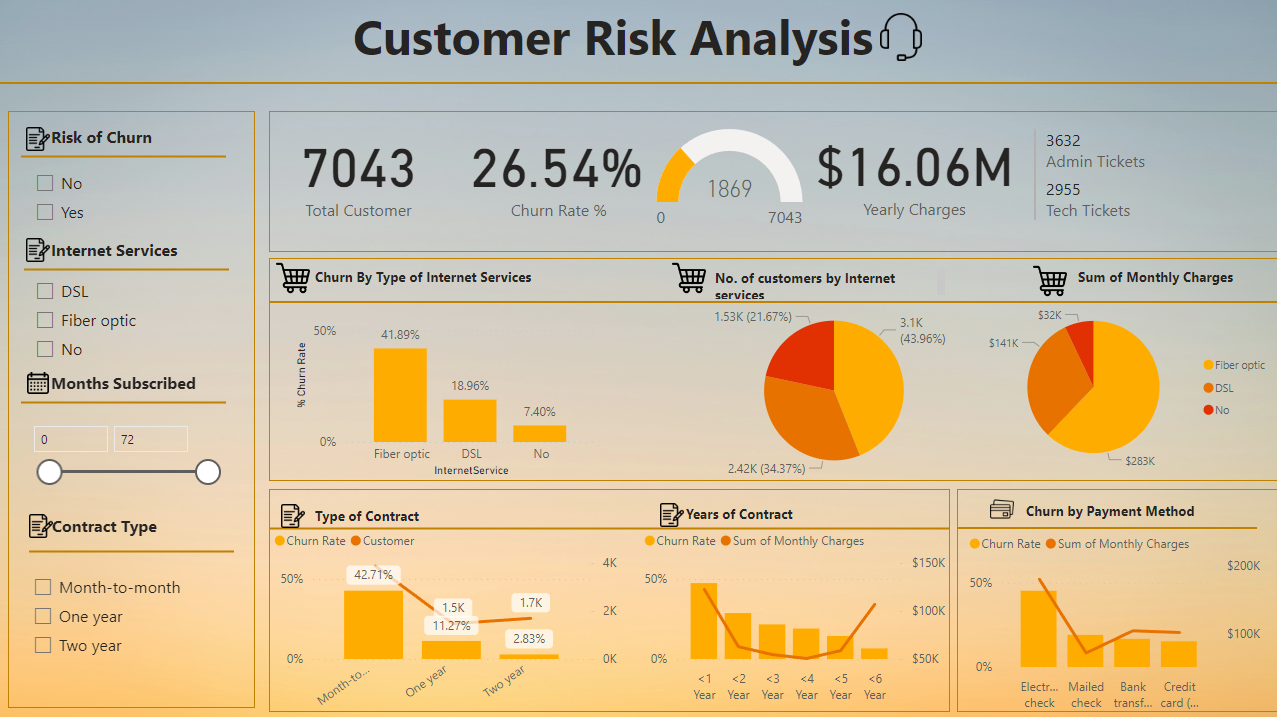
The brief from PwC was simple: figure out who's leaving and why. The dashboard cross-references retention data with demographics, service type, and billing data to pinpoint the slices of the customer base where churn risk is concentrated — and where targeted retention will deliver the most lift.
Techniques
Slicers
Tables
Charts
Visualization
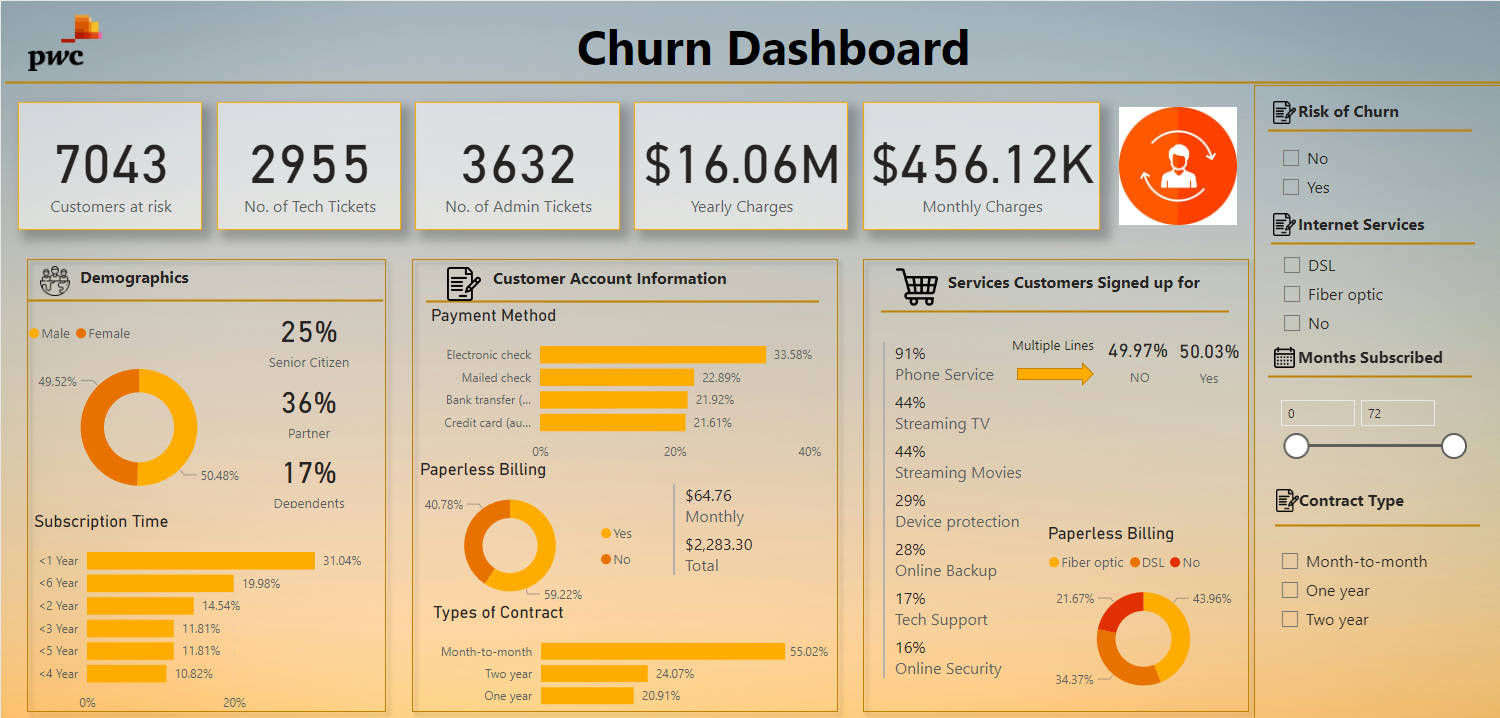
Key Findings
- Identified the percentage of retained vs churned customers, along with the annual and monthly revenue impact.
- Found demographics more prone to churn — notably senior citizens using Fiber Optic internet.
- Delivered data-driven insights on improving tech support, offering better plans, and retaining high-value customers.