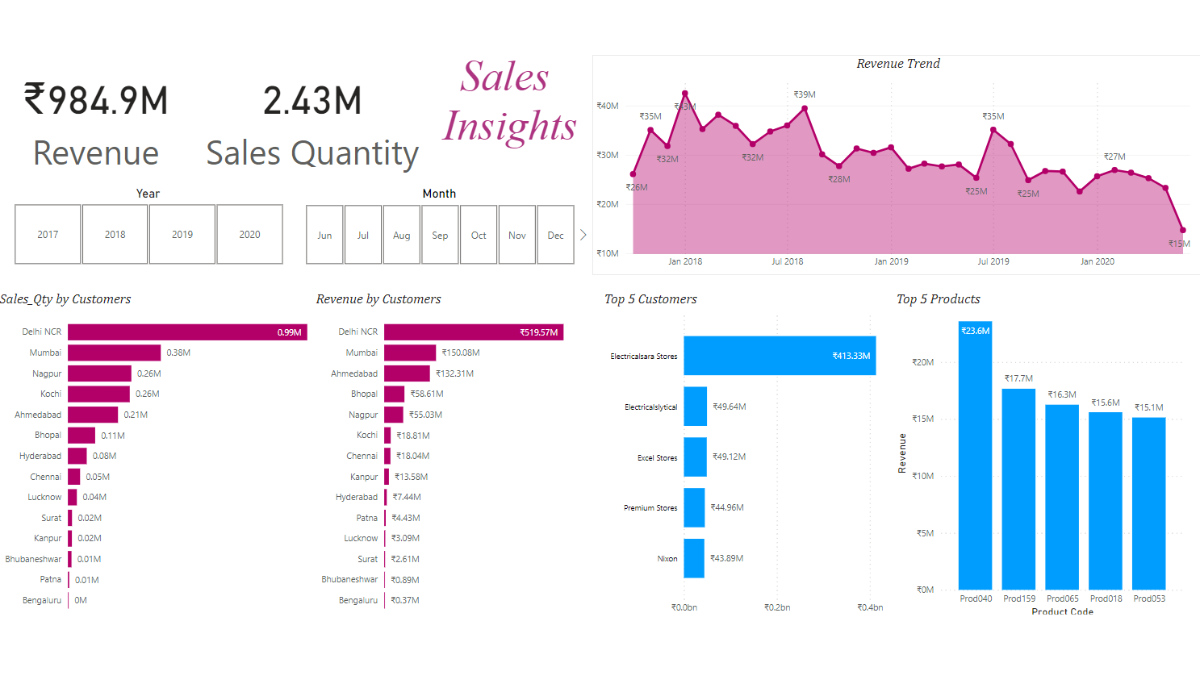
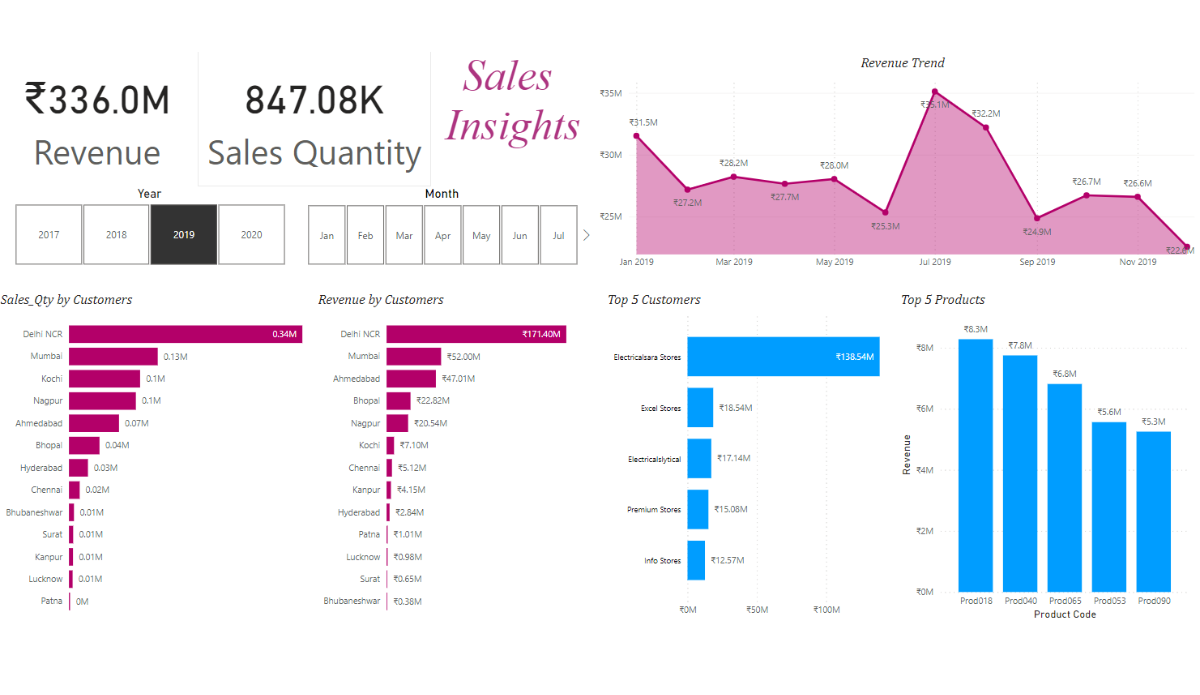
Real-Time Sales Insights Dashboard
An end-to-end sales analytics pipeline — Python-cleaned data, Excel-validated integrity, and an interactive Power BI dashboard surfacing revenue trends and sales quantity for the sales team's daily decisions.
Python
Excel
SQL
Power BI
Overview
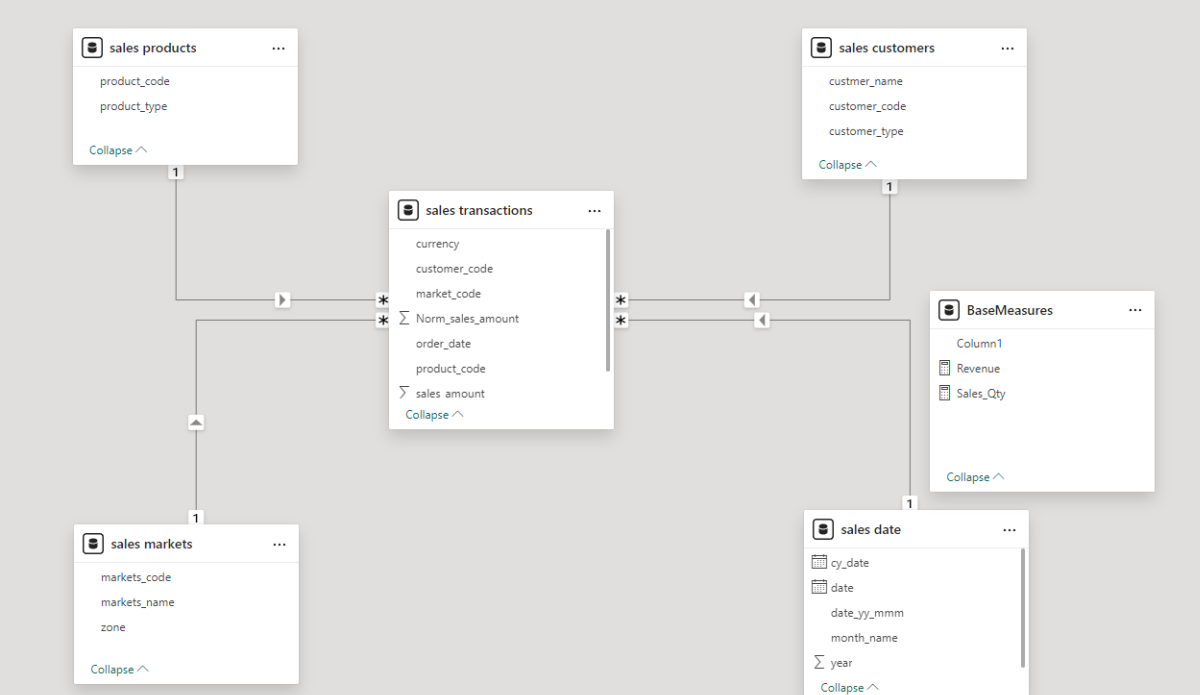
Sales data is messy, real-time, and high-stakes. This project builds the full pipe: Python (pandas) handles the cleaning and reshaping, Excel formulas validate the joins, and Power BI delivers a dashboard the sales team can open first thing in the morning and know exactly where to focus.
Techniques
Python Pandas
XLOOKUP
Conditional Formatting
Visualization
Key Findings
- Leveraged Python Pandas for data cleaning and preparation, then built an interactive Power BI dashboard on top.
- Implemented advanced Excel formulas (XLOOKUP, Conditional Formatting) to check data quality before feeding visualizations.
- Enhanced sales team decision-making by providing clear visualizations of revenue trends and sales quantity.