Employee Survey Insights
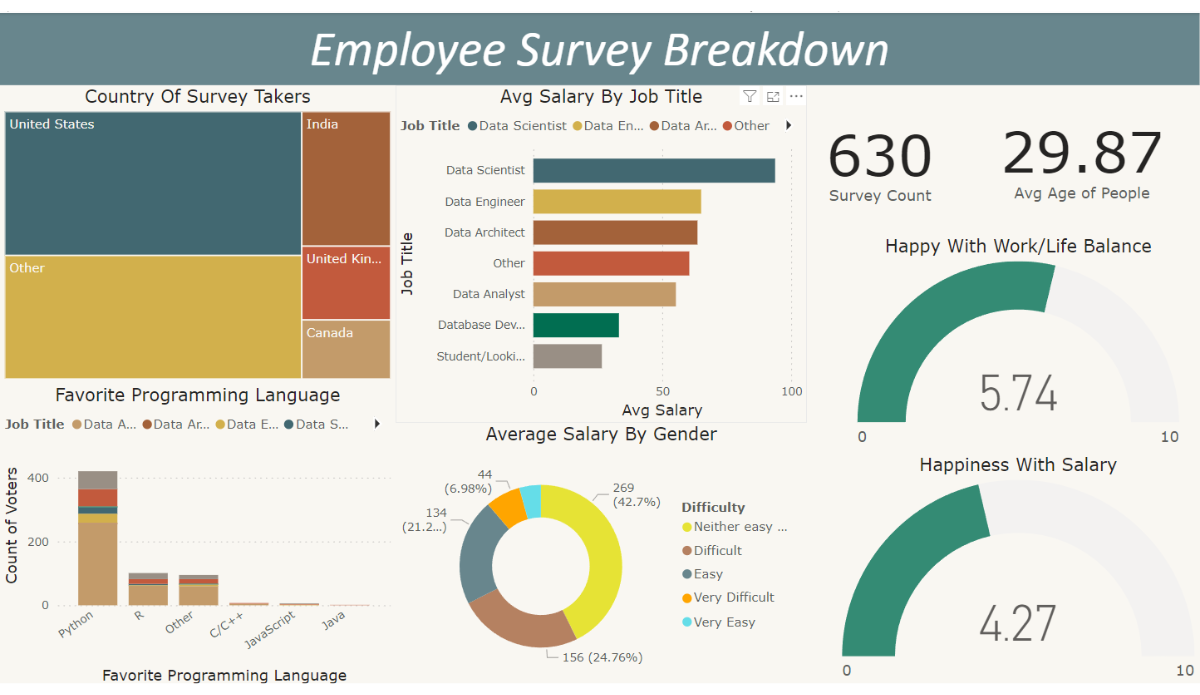
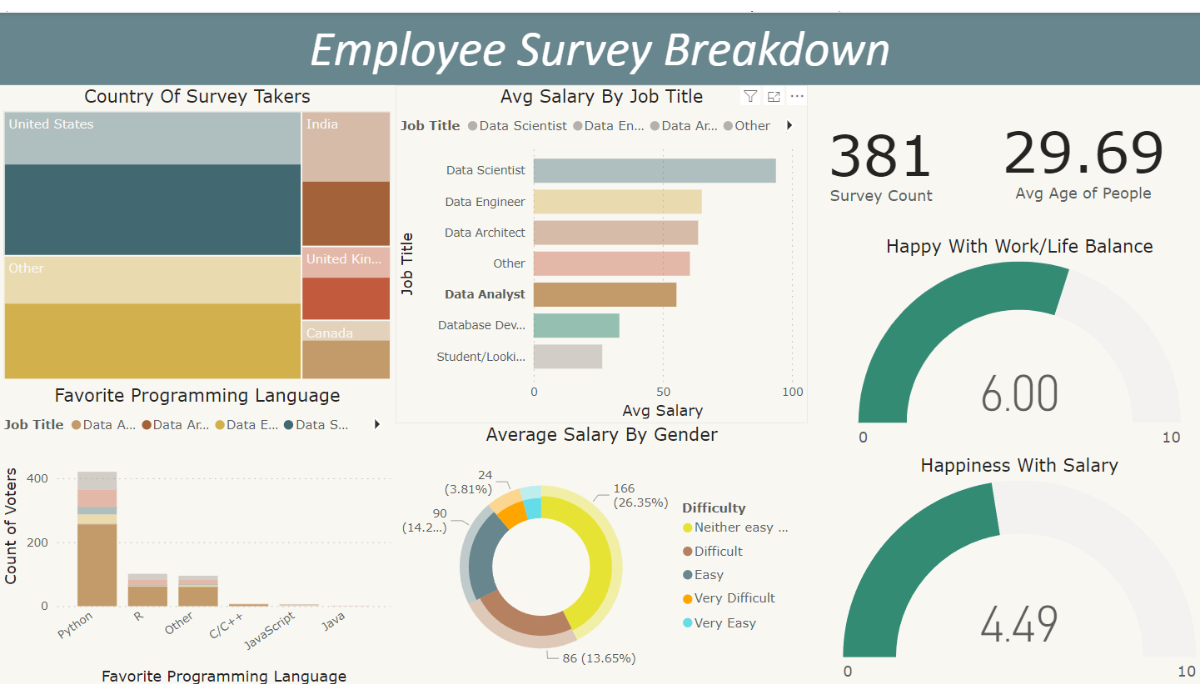
A Power BI dashboard built on a complex employee survey dataset — surfacing salary by job title and gender, work-life and salary satisfaction, popular programming languages, and employee geography for HR and leadership.
Python
Excel
SQL
Power BI
Overview
Employee survey data is a mess of free-text, nullable fields, and subjective scales. This project's win was upstream: a rigorous cleaning pipeline (pandas + SQL + Excel) that made the downstream Power BI dashboard trustworthy — so when leadership looked at salary gaps or satisfaction scores, the numbers held up.
Techniques
Python Pandas
XLOOKUP
Conditional Formatting
Visualization
Key Findings
- Leveraged Python's Pandas library, SQL queries, and Excel functions to meticulously clean and prepare a complex employee dataset — handling missing values, removing outliers, ensuring consistency.
- Constructed a compelling Power BI dashboard showcasing key employee metrics: average salary by job title and gender, work-life and salary satisfaction, popular programming languages, and employee location.
- Demonstrated proficiency in data analytics tools to diagnose and solve data quality issues — ensuring the final dashboard was reliable and insightful.